Building Singapore EV Trends
Introduction
The car market in Singapore is unique and niche compared to all other car markets in the world. This is because we have policies from the government that controls the car population in Singapore. As someone whom likes to analyse the data to look at trends, I have decided to create a data visualisation using Land Transport Authority (LTA) publicly published data on Land Transport Datamall. This also allowed me to explore new challenges and play around with new software tools that I wish to add to my arsenal of skills such as Serverless Stack Toolkit (SST), Amazon Web Services (AWS), database, etc...
In this blog post, I will go as in-depth as possible to talk about how I create the data visualisation site, my motivation,the tools/skills I used, the challenges faced, and my future plans for this. I hope you will enjoy reading this as much as I have spent the time building and writing the story behind it.
You can check out the websites in two parts; the frontend and API.
| Frontend | API |
|---|---|
| Singapore EV Trends Frontend GitHub Source Code | Singapore EV Trends API GitHub Source Code |
Motivation
This is the first time I am building an API of a relatively large scale. As a frontend developer focused Software Engineer, I would love to explore and add some backend knowledge in part of and hopefully to move myself up into a Fullstack Software Engineer. In the past, the APIs I build are rather simple.
Creating APIs have always been an unfamiliar task for me but ever since I came across SST, I wanted to try to use it to build APIs in a serverless way by run it on AWS using Lambda and API Gateway.
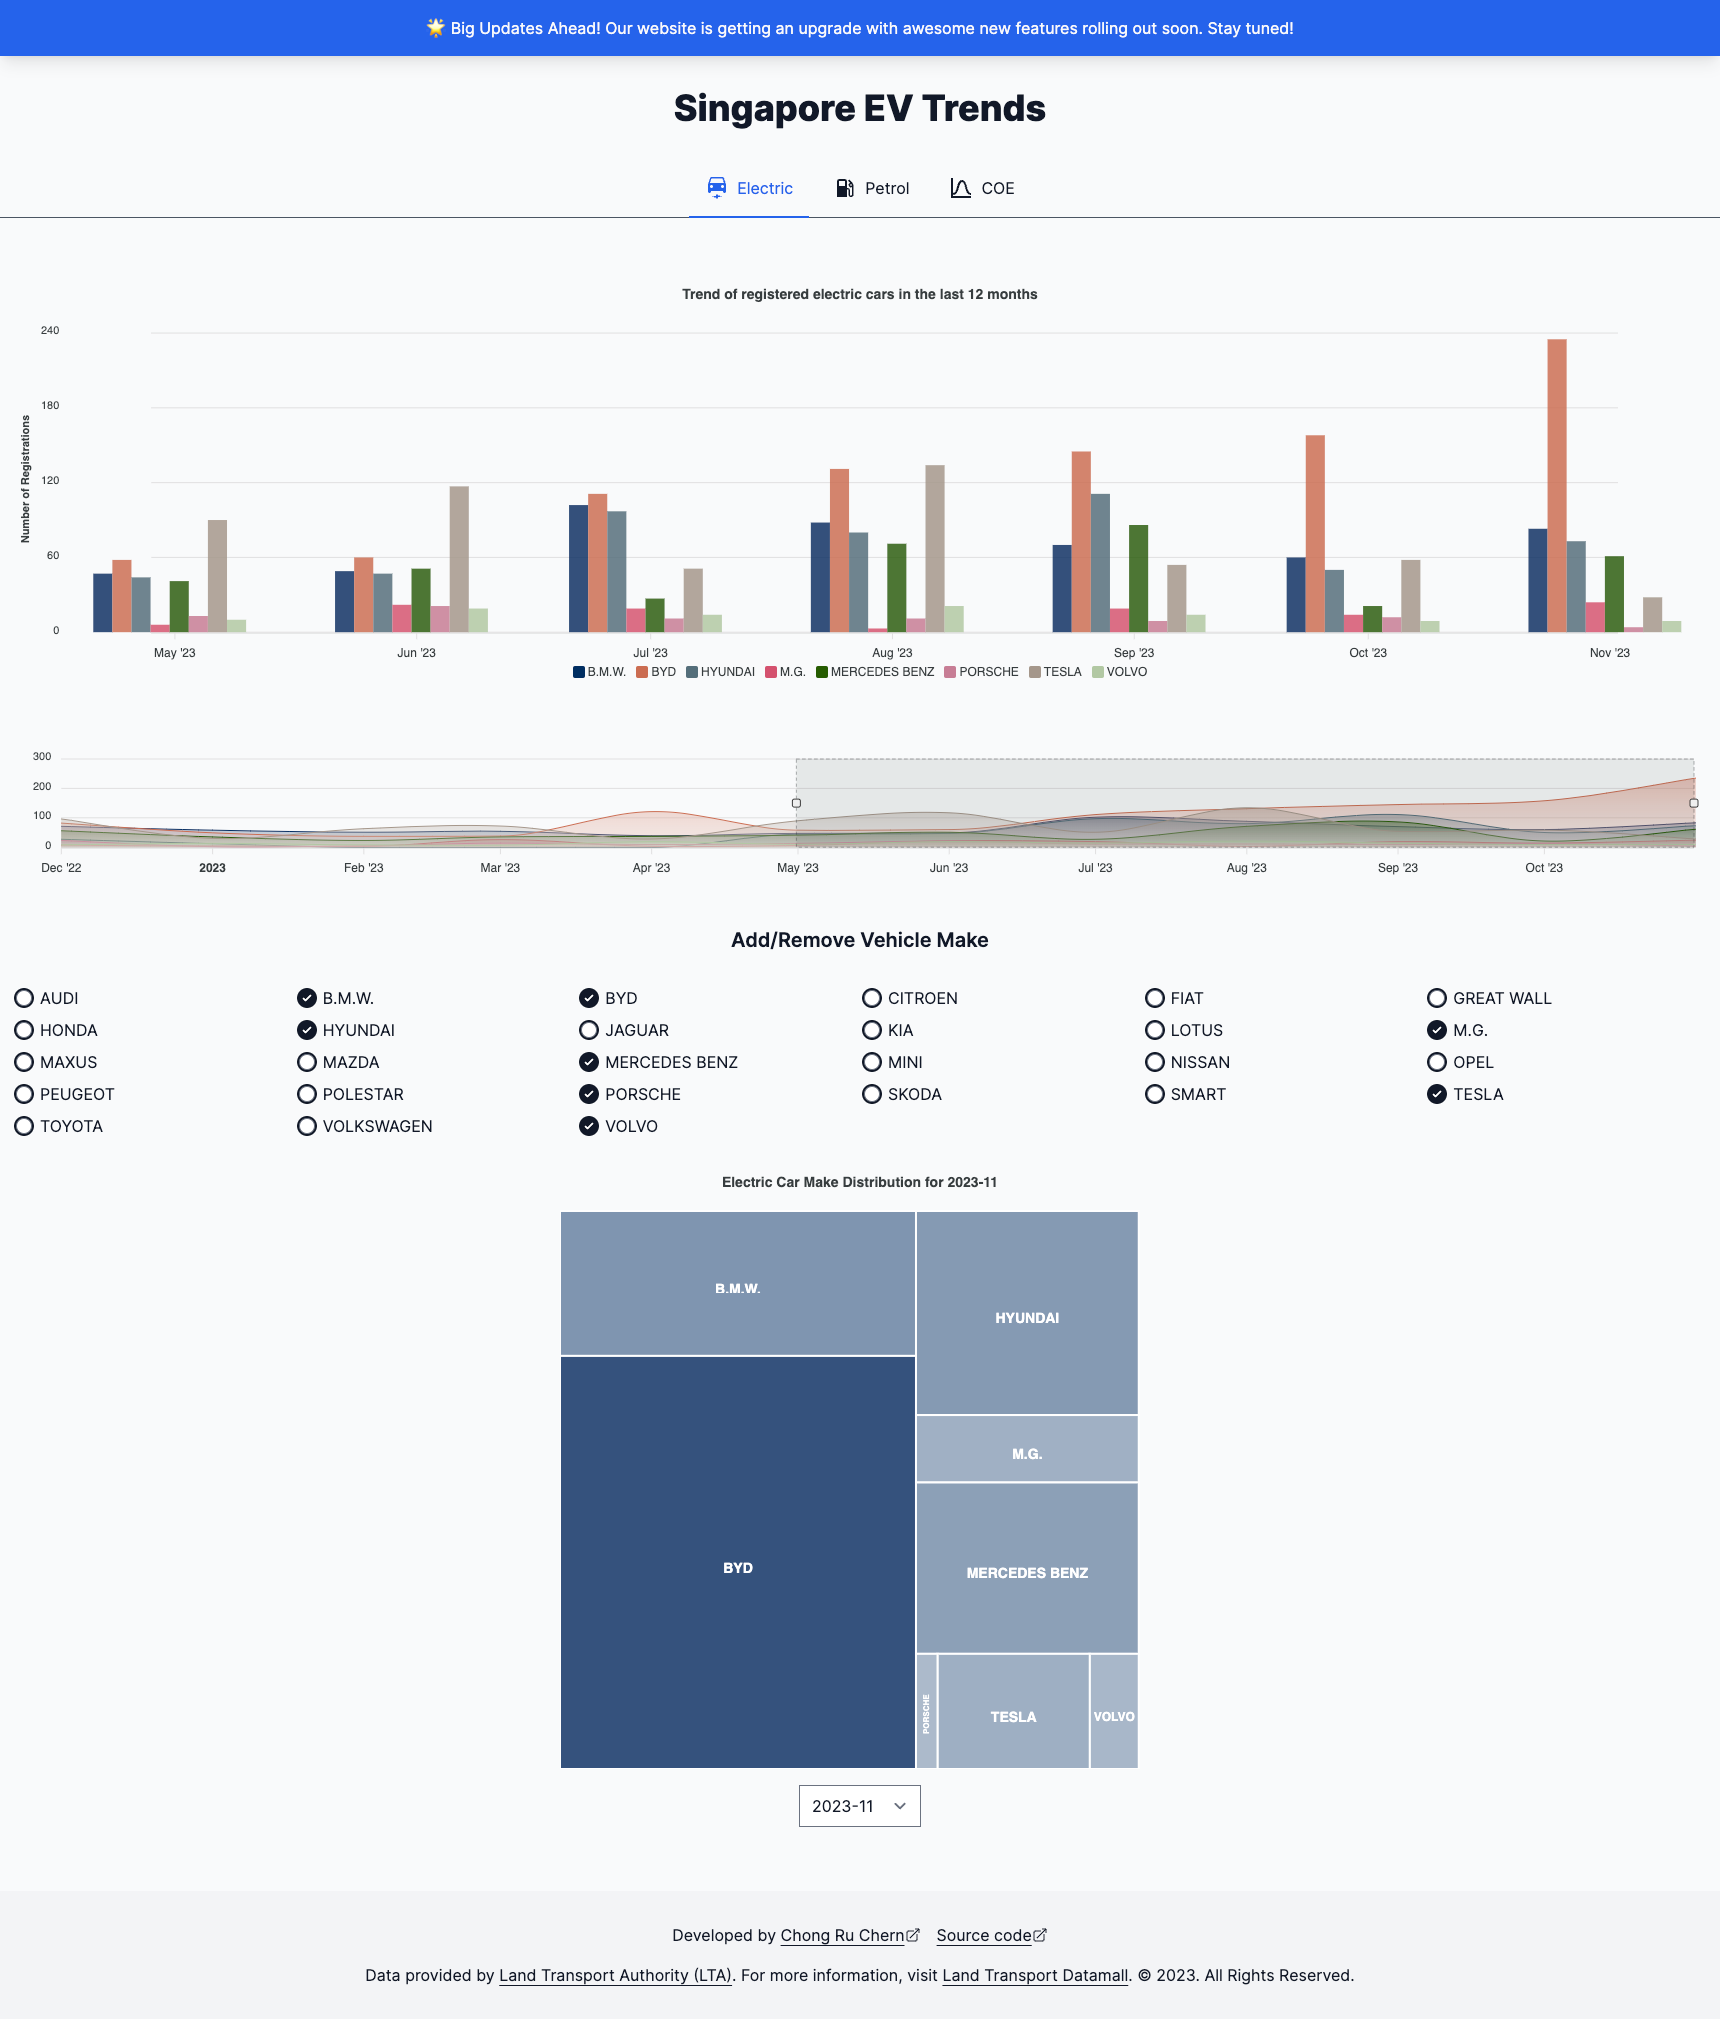
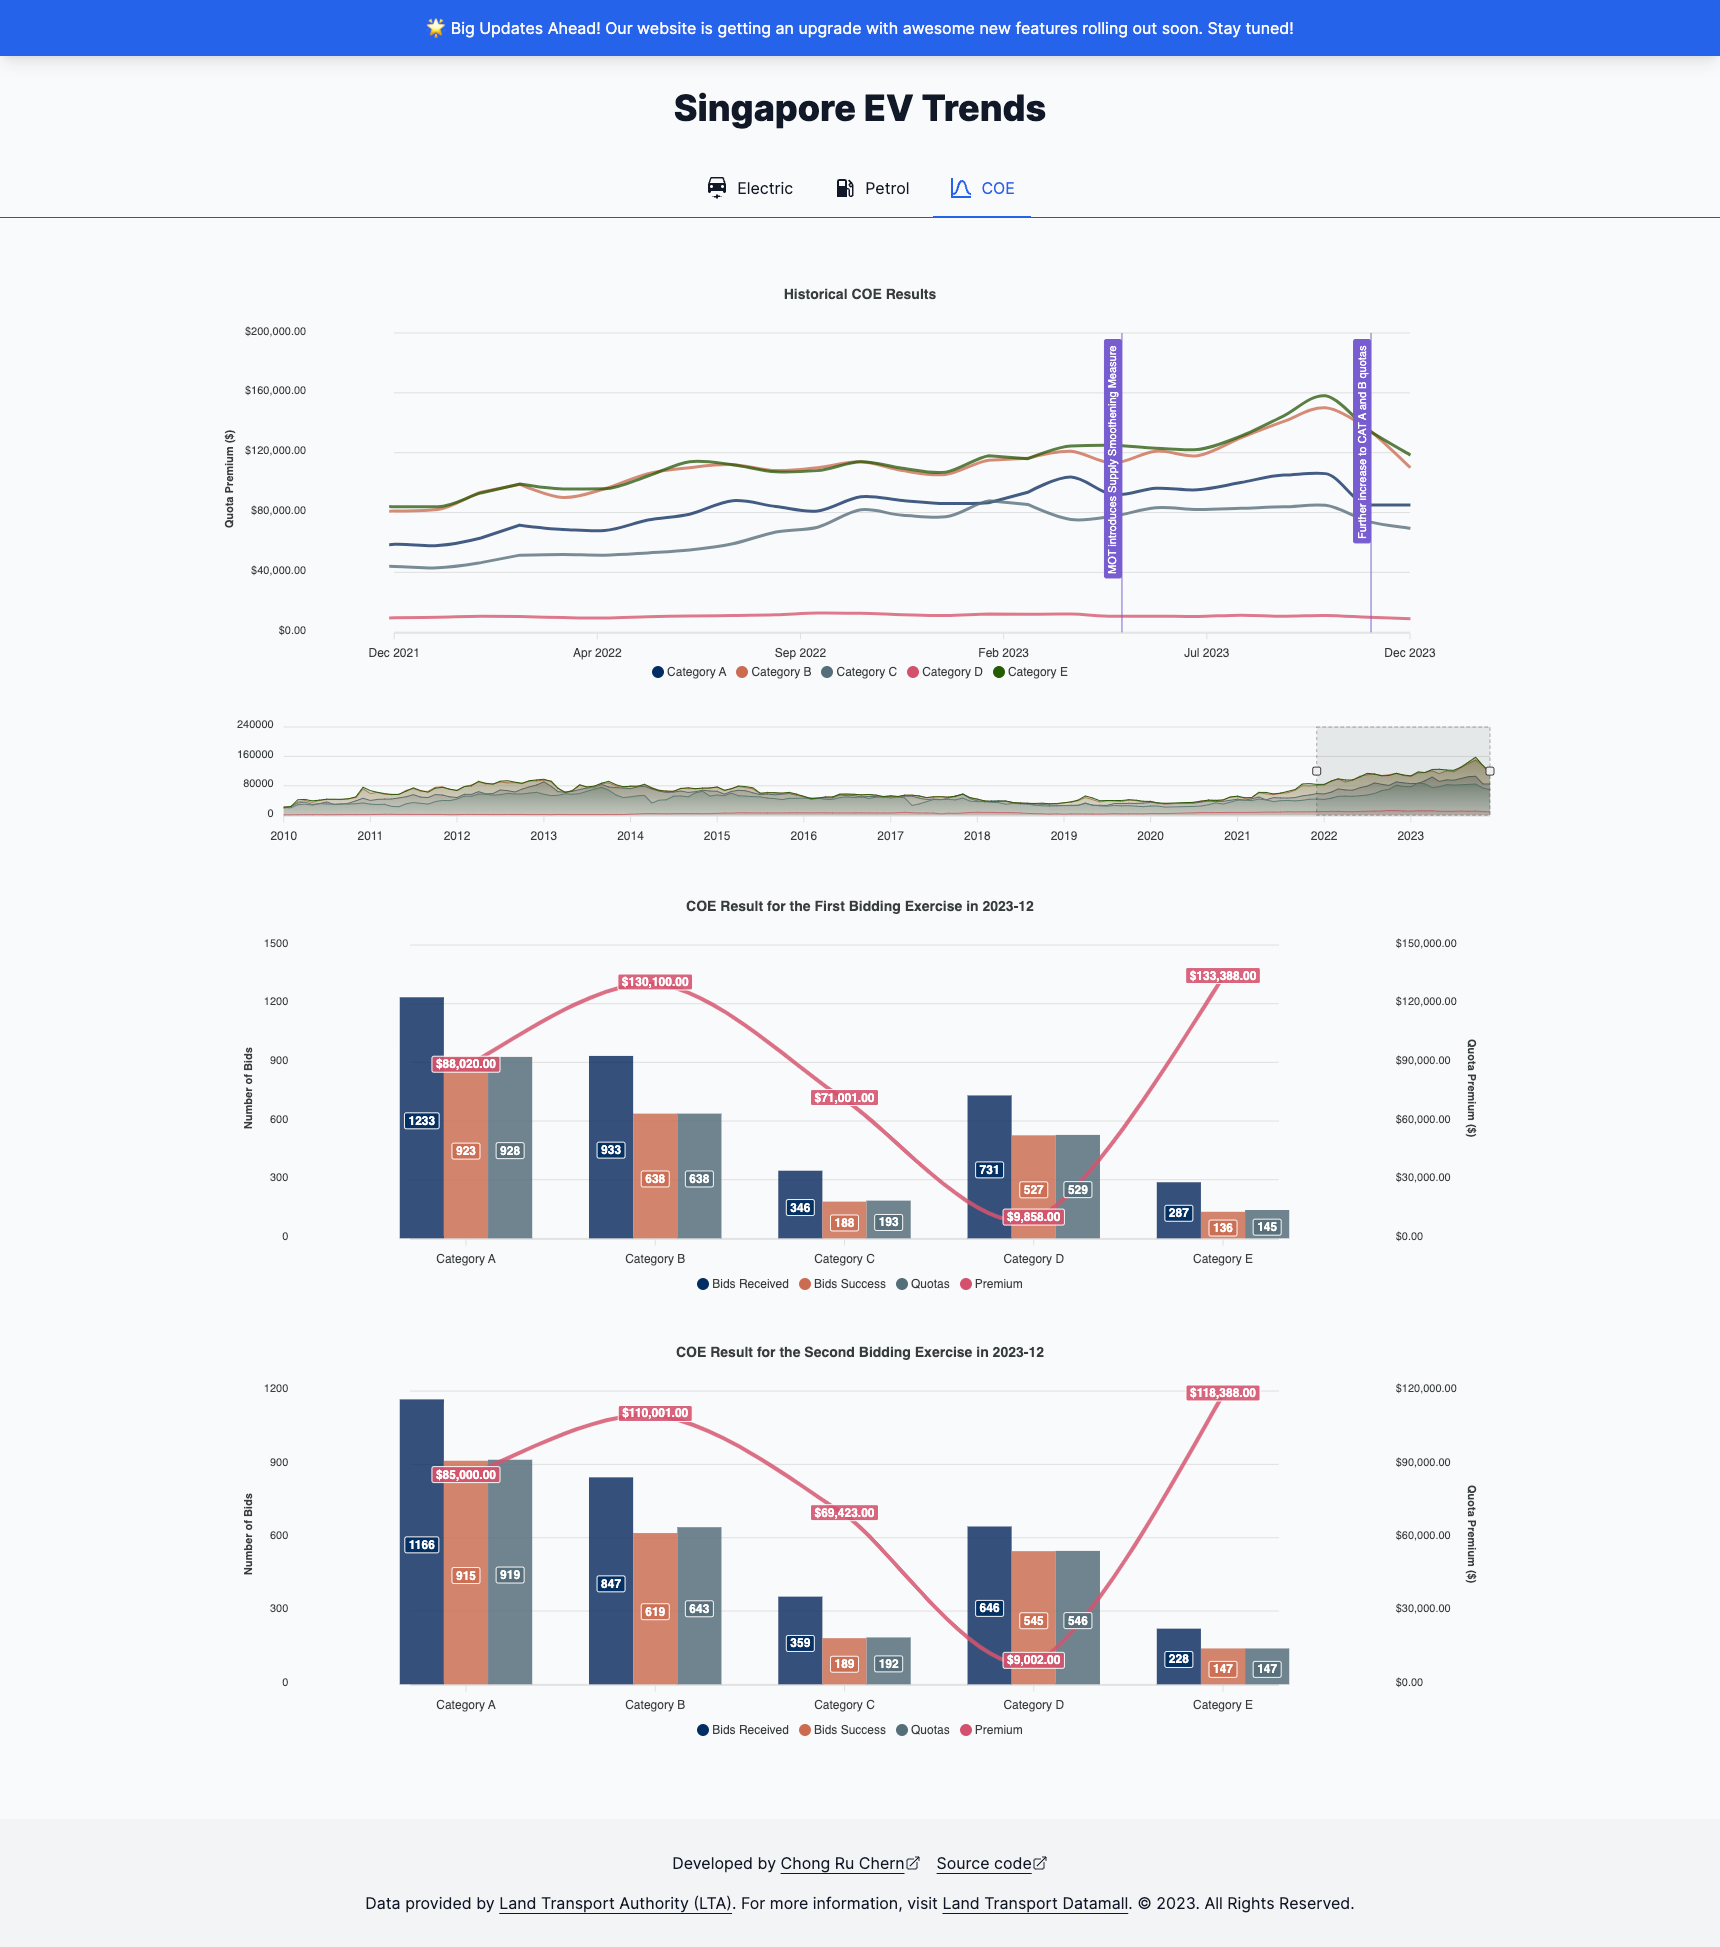
Initially, the idea was the build and create the data visuals of the electric cars adoption trend in Singapore, and the popularity of electric car brands, as the government moves towards phasing out Internal Combustion Engine (ICE) cars and cars that produce more carbon emissions on this small city-state country. As the project progresses, I found myself looking at more data and trends that I should add to the visuals like COE trends and the popularity of non-electric car brands, and many more. This has now quickly becoming a "Singapore Car Trends" rather than "Singapore EV Trends".
Creating the API
This is the most important part of the entire project because I needed to programmatically download the datasets from Land Transport Datamall into their respective ZIP files. After which, I have to extract the ZIP files into their respective CSV files.
I used the following libraries to help me with this:
Because I am also expected to download many different datasets, so I have created a downloadFile.ts reusable helper and returning a response type of "stream".
import axios from "axios";
import fs from "fs";

type DownloadFileOptions = {
  url: string;
  destination: string;
};

export const downloadFile = async ({
  url,
  destination,
}: DownloadFileOptions): Promise<void> => {
  const response = await axios({
    method: "get",
    url: url,
    responseType: "stream", // Ensure a readable stream is returned
  });

  const writer = fs.createWriteStream(destination);

  return new Promise<void>((resolve, reject) => {
    response.data.pipe(writer);
    writer.on("finish", resolve);
    writer.on("error", reject);
  });
};
Choosing a Database
Downloading, unzipping and parsing the data all require long response time and I should not be repeating this process each time the API endpoint is called. Therefore, I decided to store the parsed data in JSON into a database. This would allow me to query the necessary data from the database when hitting the endpoint, resulting in a faster response time.
Since the data is already in JSON format, I went with MongoDB Atlas which allowed me to configure a cluster quickly.
There are 2 ways I used to store the data, mainly using db.collection.insertMany().
- If the database is empty, I just write the entire data into the database. Straightforward here.
- If the database already contains existing data, I want to only write the newer data.
Let's talk about (2). The rationale of splitting the data here is to prevent accidental duplication of data using db.collection.insertMany(). I have tried to explore the db.collection.upsert() but the operations were taking a long time.
Below is a snippet (pseudo-code) of how I split the data into existing and newer data.
// First, I fetch the existing data from the database
const existingData: WithId<Document>[] = await collection.find().toArray();

// Function to match the important keys for filtering
const createUniqueKey = <T extends object>(
  item: T,
  keyFields: Array<keyof T>
): string =>
  keyFields
    .filter((field) => item[field])
    .map((field) => item[field])
    .join("-");

// Map the existing data to something like [ { key: value } ]
const existingDataMap: Map<string, WithId<Document>> = new Map(
  existingData.map((item) => [createUniqueKey(item, keyFields), item])
);

// Extract the data which does not match the existing data
const newDataToInsert = parsedData.filter(
  (newItem) => !existingDataMap.has(createUniqueKey(newItem, keyFields))
);

// Write to the database based on the conditions met
if (newDataToInsert.length > 0) {
  const result = await collection.insertMany(newDataToInsert);
  return `${result.insertedCount} document(s) inserted`;
} else {
  return `No new data to insert. The provided data matches the existing records.`;
}
Scheduler
Since LTA publishes these data at a consistent schedule, I wanted an automated way to update my database with their updated datasets too. AWS CloudWatch EventBridge rules allowed me to easily do this.
Because LTA publishes the datasets at different times, I had to create different schedulers to handle this.
- LTA publishes the monthly car registration during mid of the month. We do not have a fixed date for this, but we do know that these are done on the weekdays.
- COE results. This is even more tricky. There are 2 bidding exercises per month. The bidding ends on the 1st and 3rd Wednesday of the month at 16:00 SGT (excluding some irregularities). However, there is a delay in the COE data being uploaded.
Challenges
1. Cron Expression
AWS support cron syntax is very different from the usual syntax of a typical cron expression. As such, I needed to generate the cron expression and cross reference with the AWS documentation. This took awhile due to unfamiliarity and it became a bit of trial and error while creating it.
2. Cross Origin Resource Sharing (CORS)
While creating the API, I have added the header Access-Control-Allow-Origin to only allow the domain singapore-ev-trends.ruchern.xyz. This quickly became a problem when I started to build the frontend and calling the API. With the whitelisting, I have effectively now denied myself from using my own API on my frontend. Since my development server is localhost:3000, I was denied because I do not match the origin from singapore-ev-trends.ruchern.xyz. The first approach I did was to update my /etc/hostsfile to map the localhost address to the origin address. However, this quickly became a tedious problem because I need to setup a HTTPS server instead of a HTTP one. By default, Next.js development server uses the HTTP protocol. I was able to use the flag--experimental-httpson mynext dev, but this is also causing a problem. Since I was using SST and the Parameters Store to store my secrets, the script to launch my dev server is now sst bind next dev --experimental-https. This actually did not work because of the sst bind. As such, I had to drop this implementation and try another way.
The second way I used was creating different environments. With SST, I was able to set --stage dev for development and --stage prod for production.
// Mapping the CORS settings according to the stage
const CORS_SETTINGS: Record<string, any> = {
  dev: {
    allowMethods: ["GET"],
    allowOrigins: ["*"],
  },
  prod: {
    allowMethods: ["GET"],
    allowOrigins: ["https://singapore-ev-trends.ruchern.xyz"],
  },
};

// ...

// Example of how I use the CORS settings map
const config = {
  ...otherSettings, // Other config
  cors: {
    ...CORS_SETTINGS[stack.stage],
  },
};
This also became a good solution as I should have separate APIs for the different environments since I was using the Live Lambda Development feature using SST which updates each time I change the function. So now I could configure the development stage to have CORS disabled while leaving the CORS enabled for production. I have also created a separate database on MongoDB Atlas, by adding the stage prefix. This segregation allowed me to experiment and build the APIs without affecting the production version which could cause things to fail at anytime.
Creating the Frontend
The frontend is built with "T3 Stack" - a web development stack focused on simplicity, modularity, and full-stack typesafety. The core pieces of the frontend are Next.js, TypeScript and Tailwind CSS.
Next.js is an incredible React Framework that allows for both Server-side Rendering (SSR) and Client-side Rendering (CSR). This allowed me to create server side pages to render the charts and data that do not change frequently. For charts that requires interaction like changing of the month, which calls the API with the relevant inputs to view different data and its visuals, I was able to use the client-side rendering feature to achieve this. The framework also has features that helps with Search Engine Optimisation (SEO) that I could use to help bump the site on Google as much as possible.
TypeScript allowed me to add types to my data object, expected props in the React components which helps with my development. It improves the code quality, readability and understandability to specify the expected values for variables and functions.
Last but not least, Tailwind CSS. Tailwind CSS is a CSS framework for rapidly building UIs. It uses classnames to quickly create the beautiful and clean UI on the frontend.
Challenges
1. Charting Libraries
I first chose the react-chartjs2 to help me build the graphs for the electric car trends. However, this charting library seemed to be too basic for my requirements. As I continued building this project, I needed a charting data that is able to handle more complex visualisation. I compared against D3.js, Nivo, Recharts and Apex Charts. They were all good choices and eventually I went with Apex Charts. Apex Charts is able to satisfy my requirements and also looks modern and clean.
2. Charts on Mobile View
Charts contains a lot of graphics and on mobile screens, it actually looks squashed or unreadable. Since there are really no ways to create the visualisation clearly, I am planning to remove the charts and switch to a responsive tables showing the comparisons.
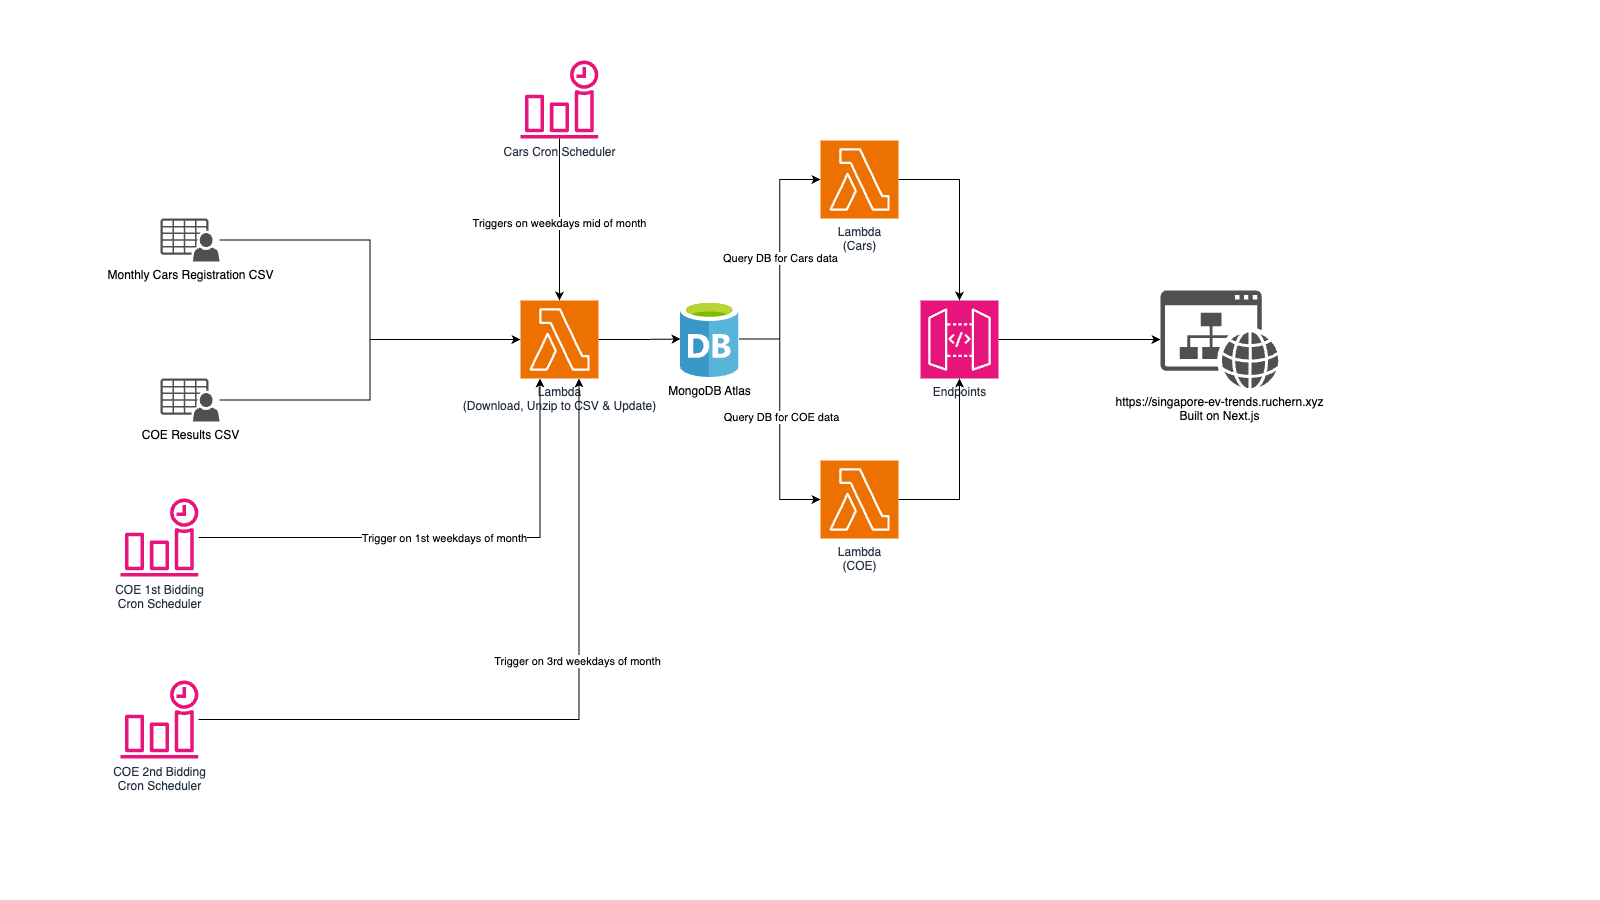
Architecture Diagram
I have created an architecture diagram of how entire flow roughly works.
Load/Performance Test
I have also done a load test on my existing APIs to check for any slow responses. The report below was generated using the performance test feature in Postman. These are not all the APIs, but the ones that are currently used for the frontend. There are other APIs currently planned and in development and will share more in due course.
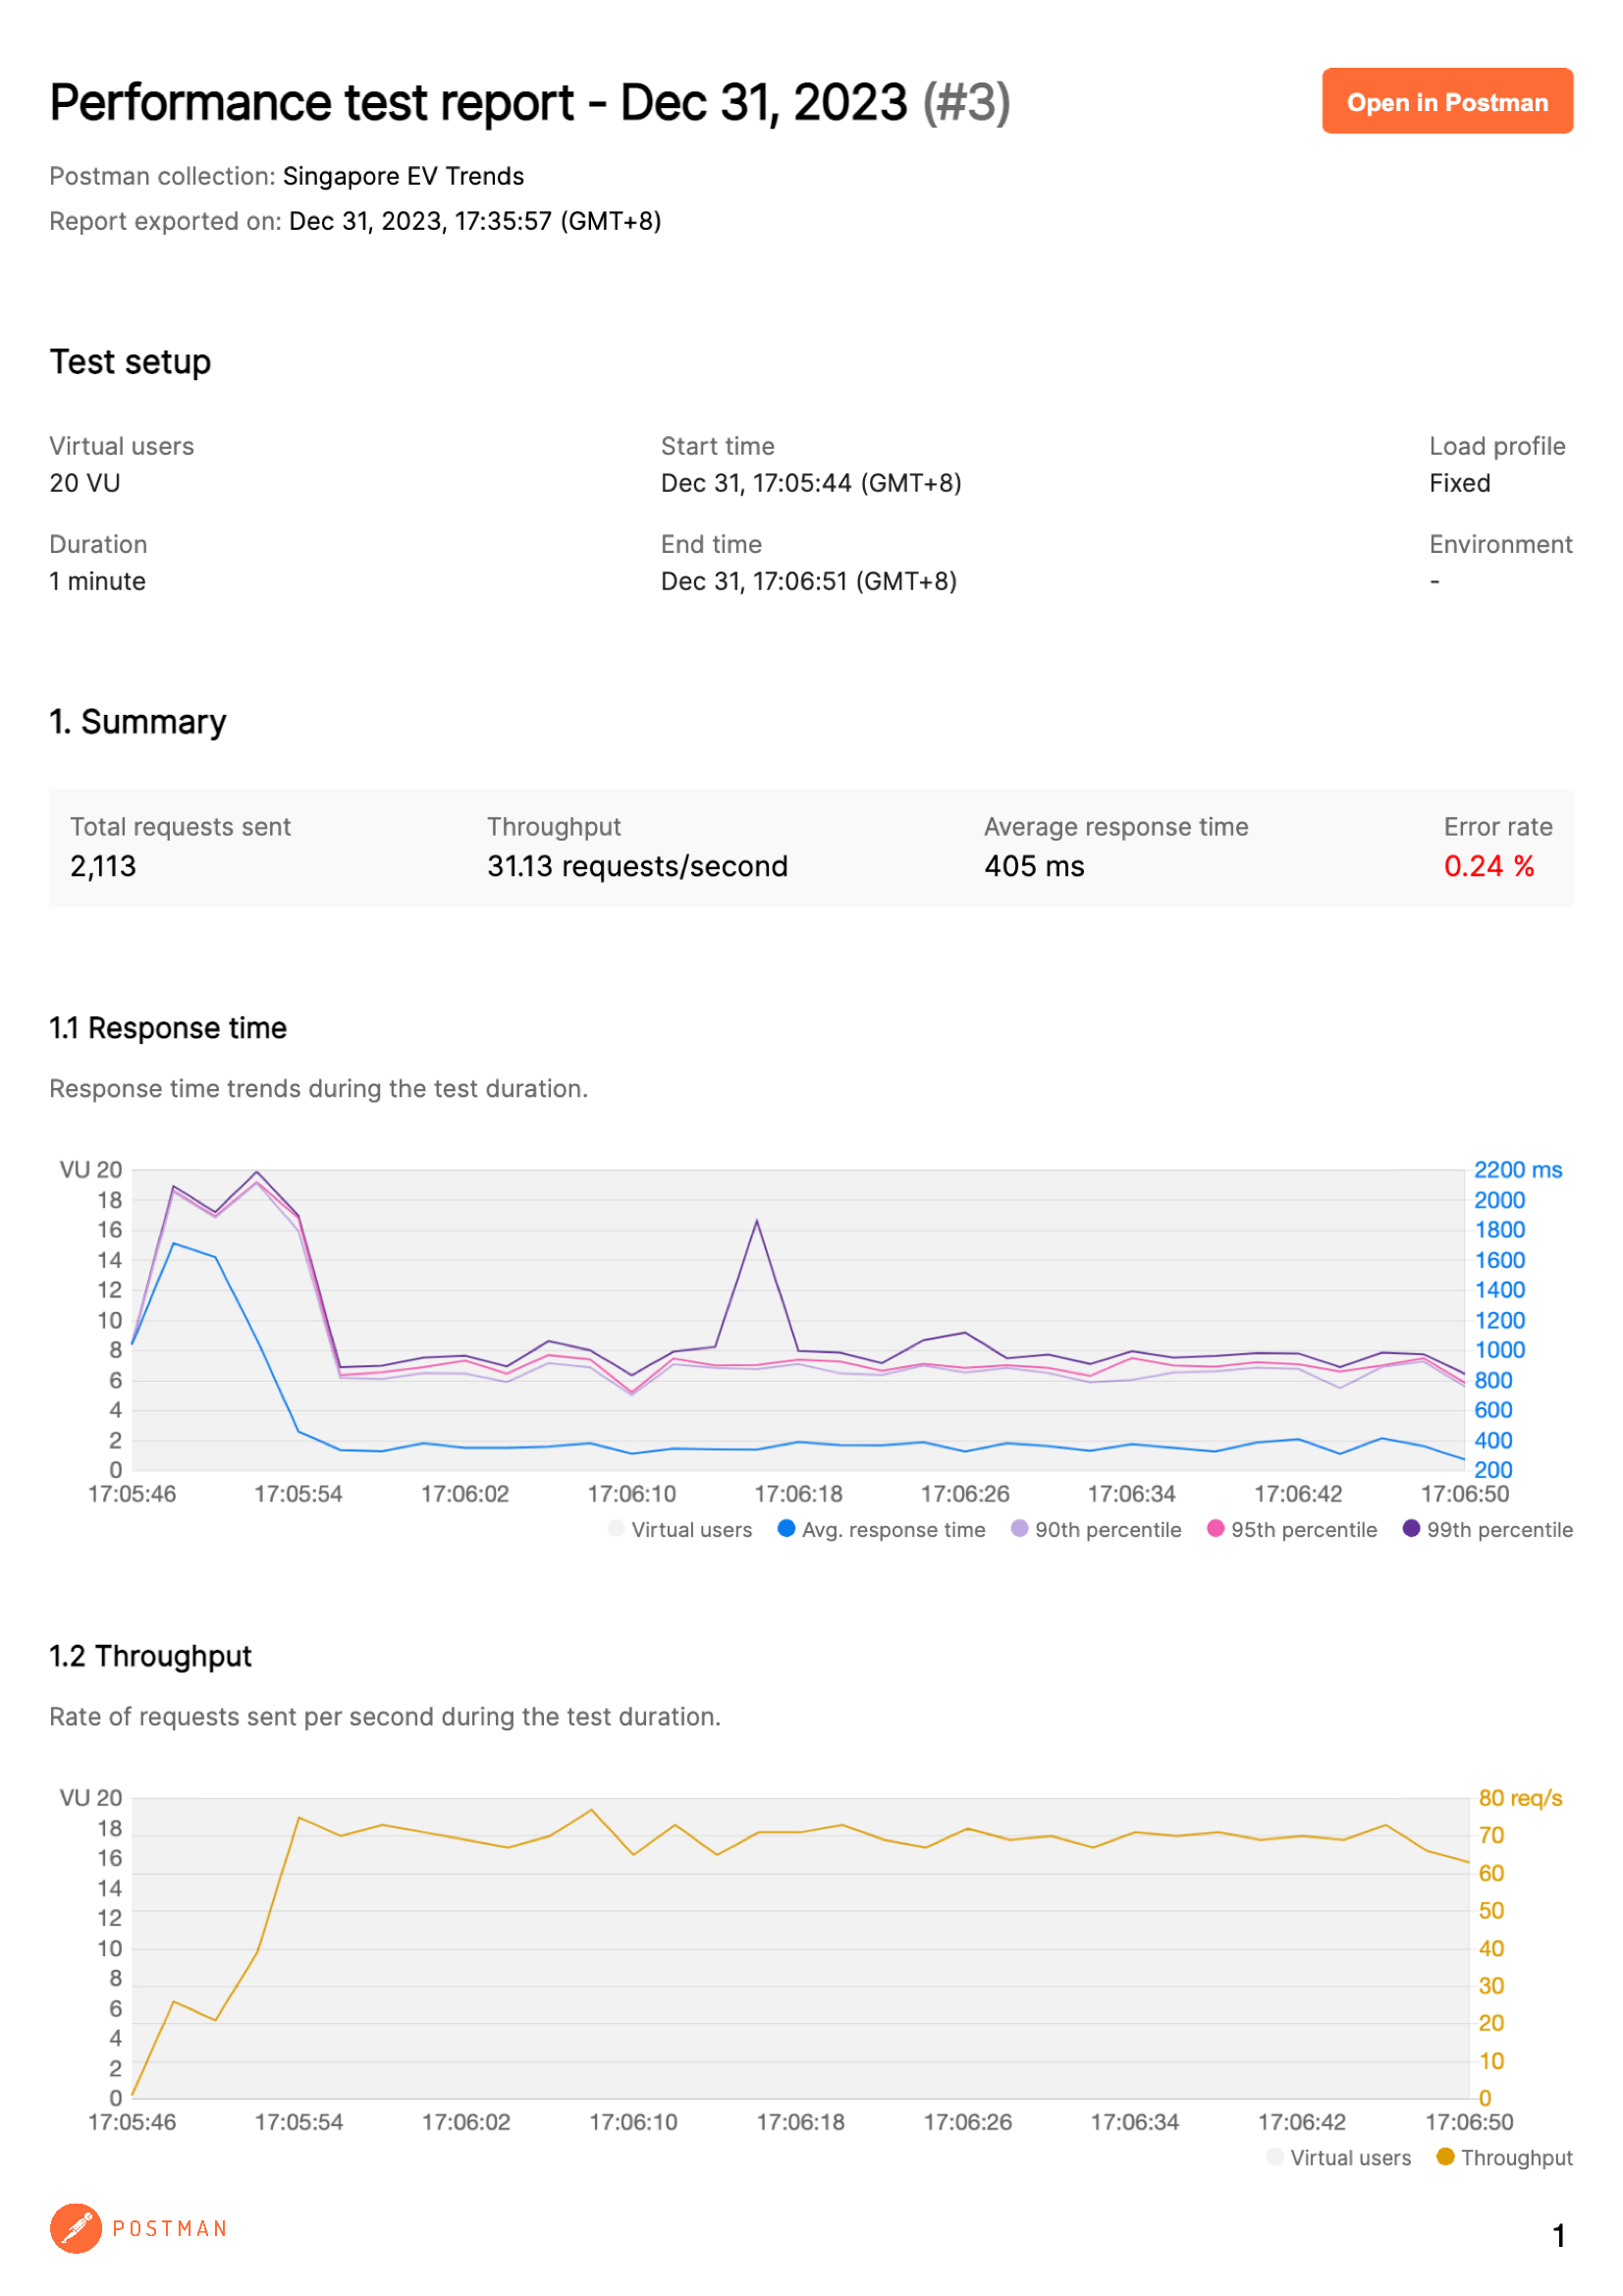
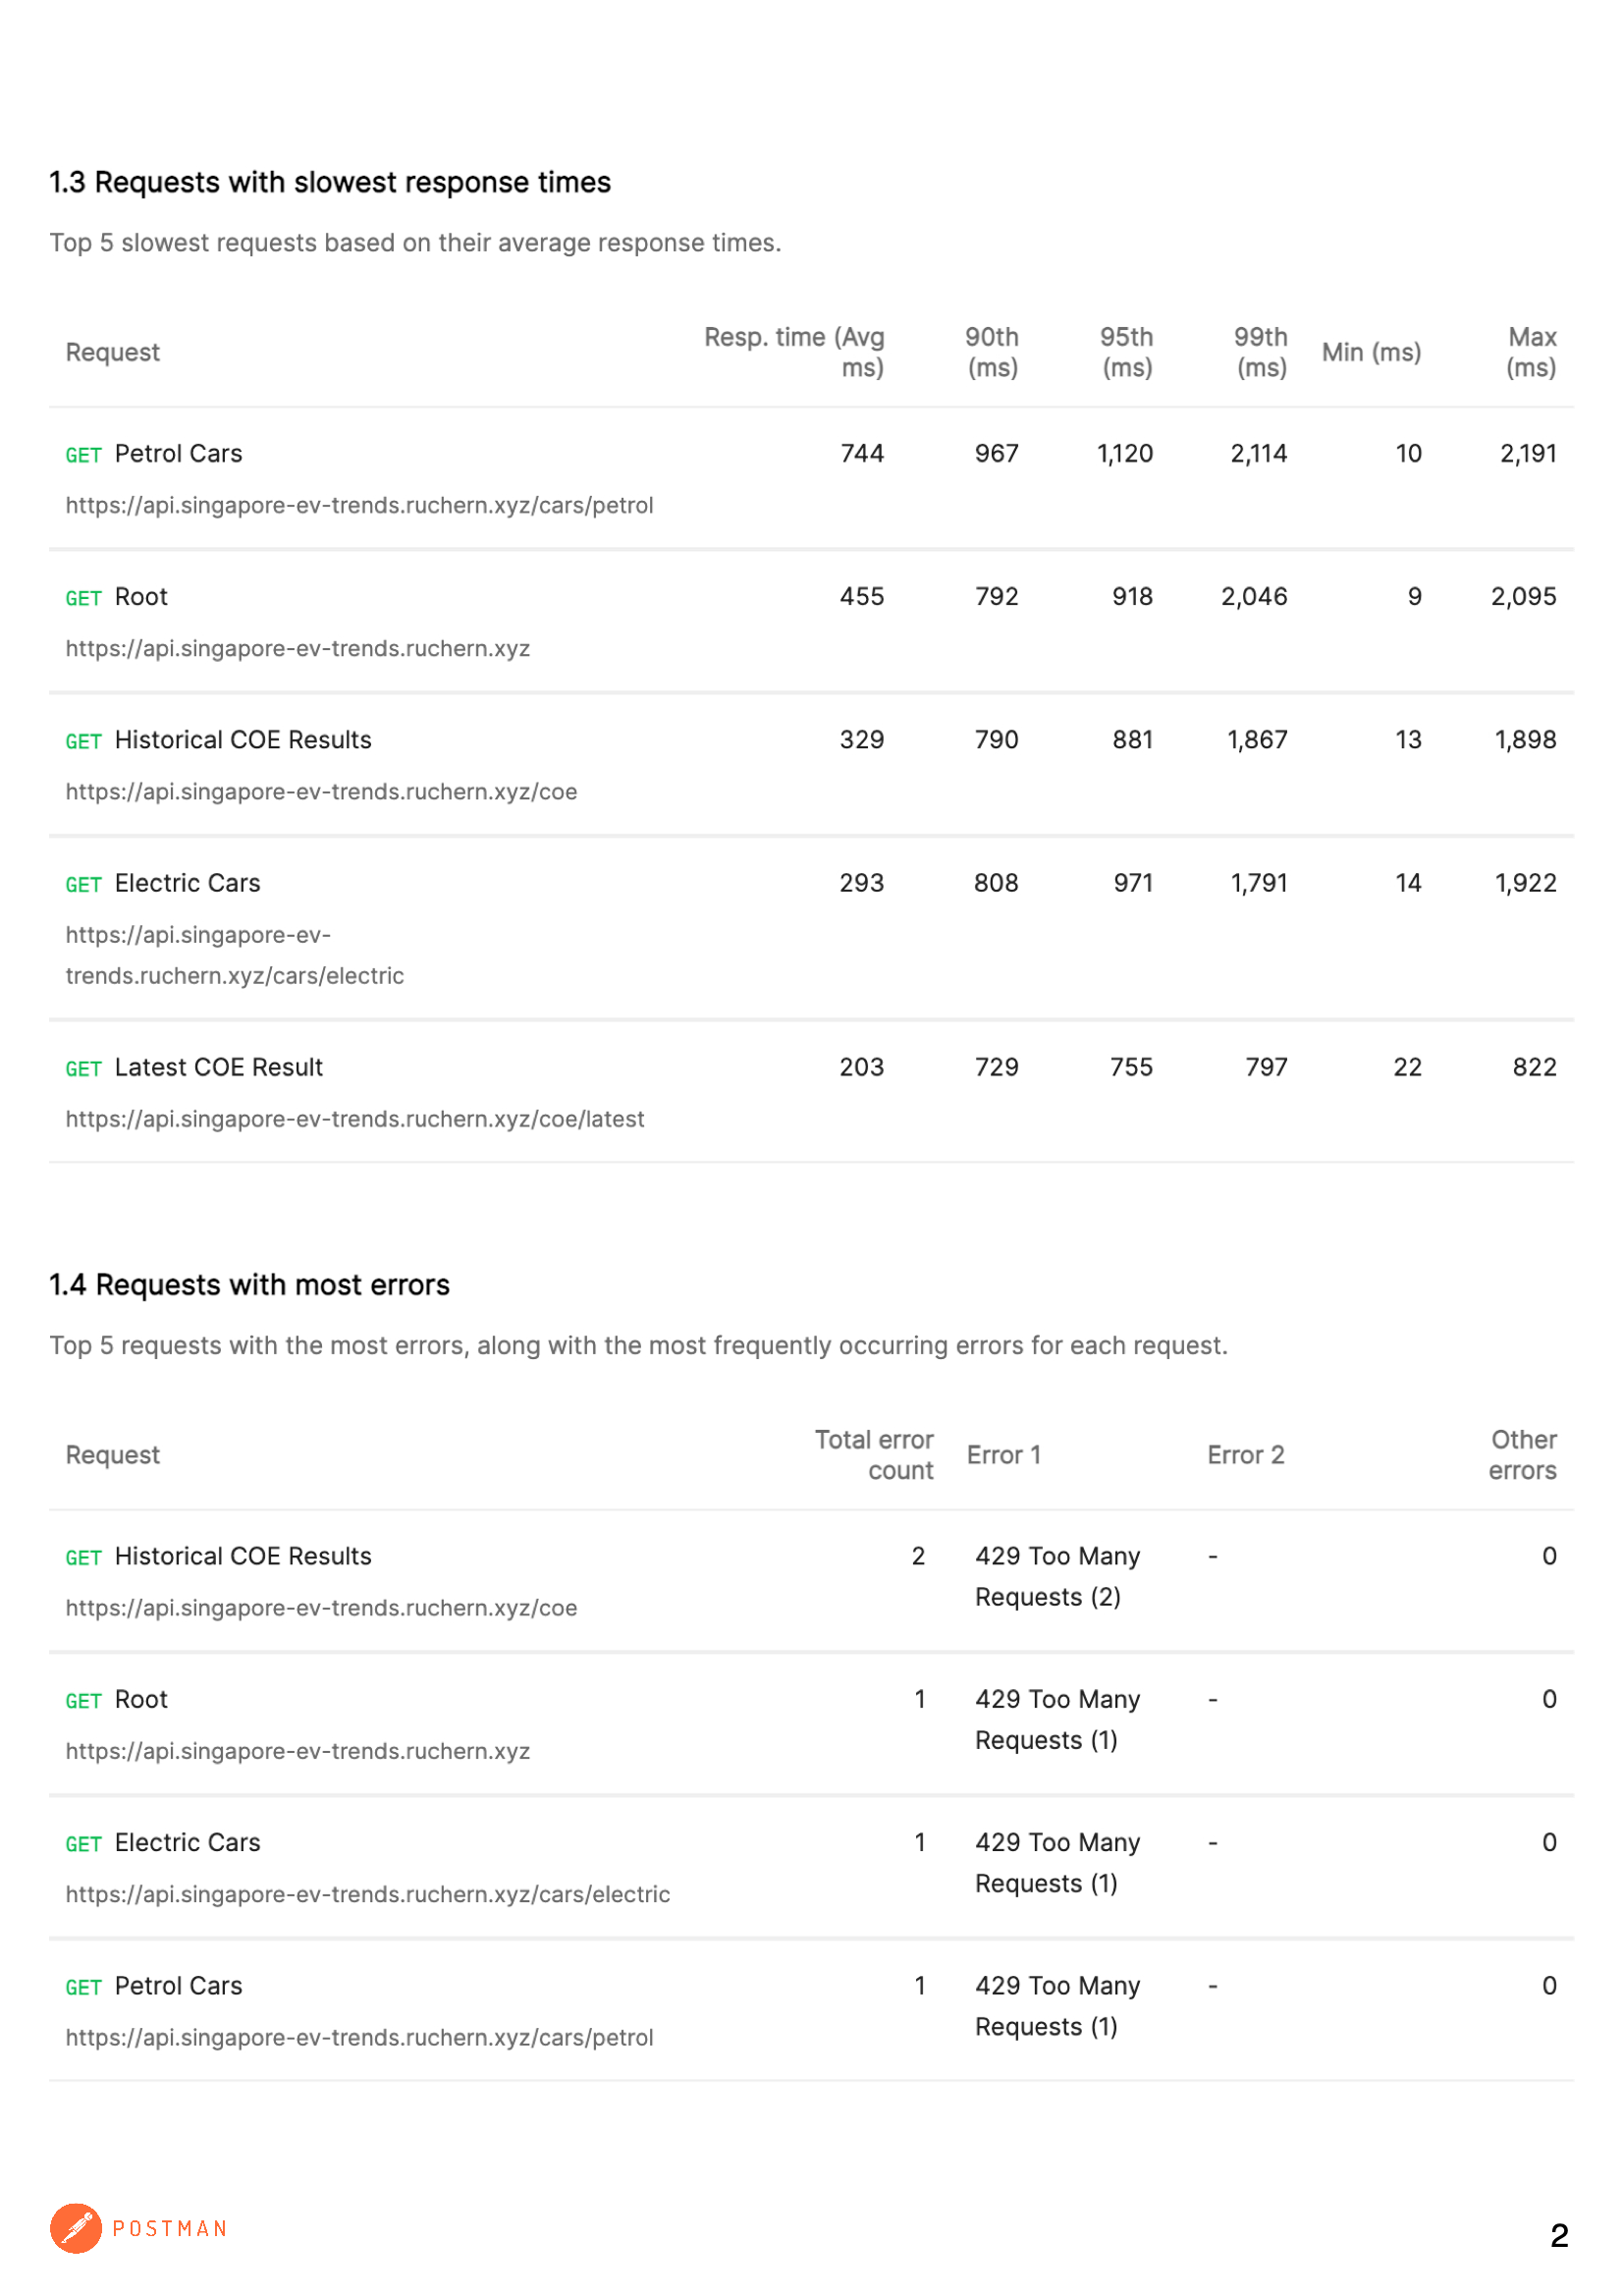
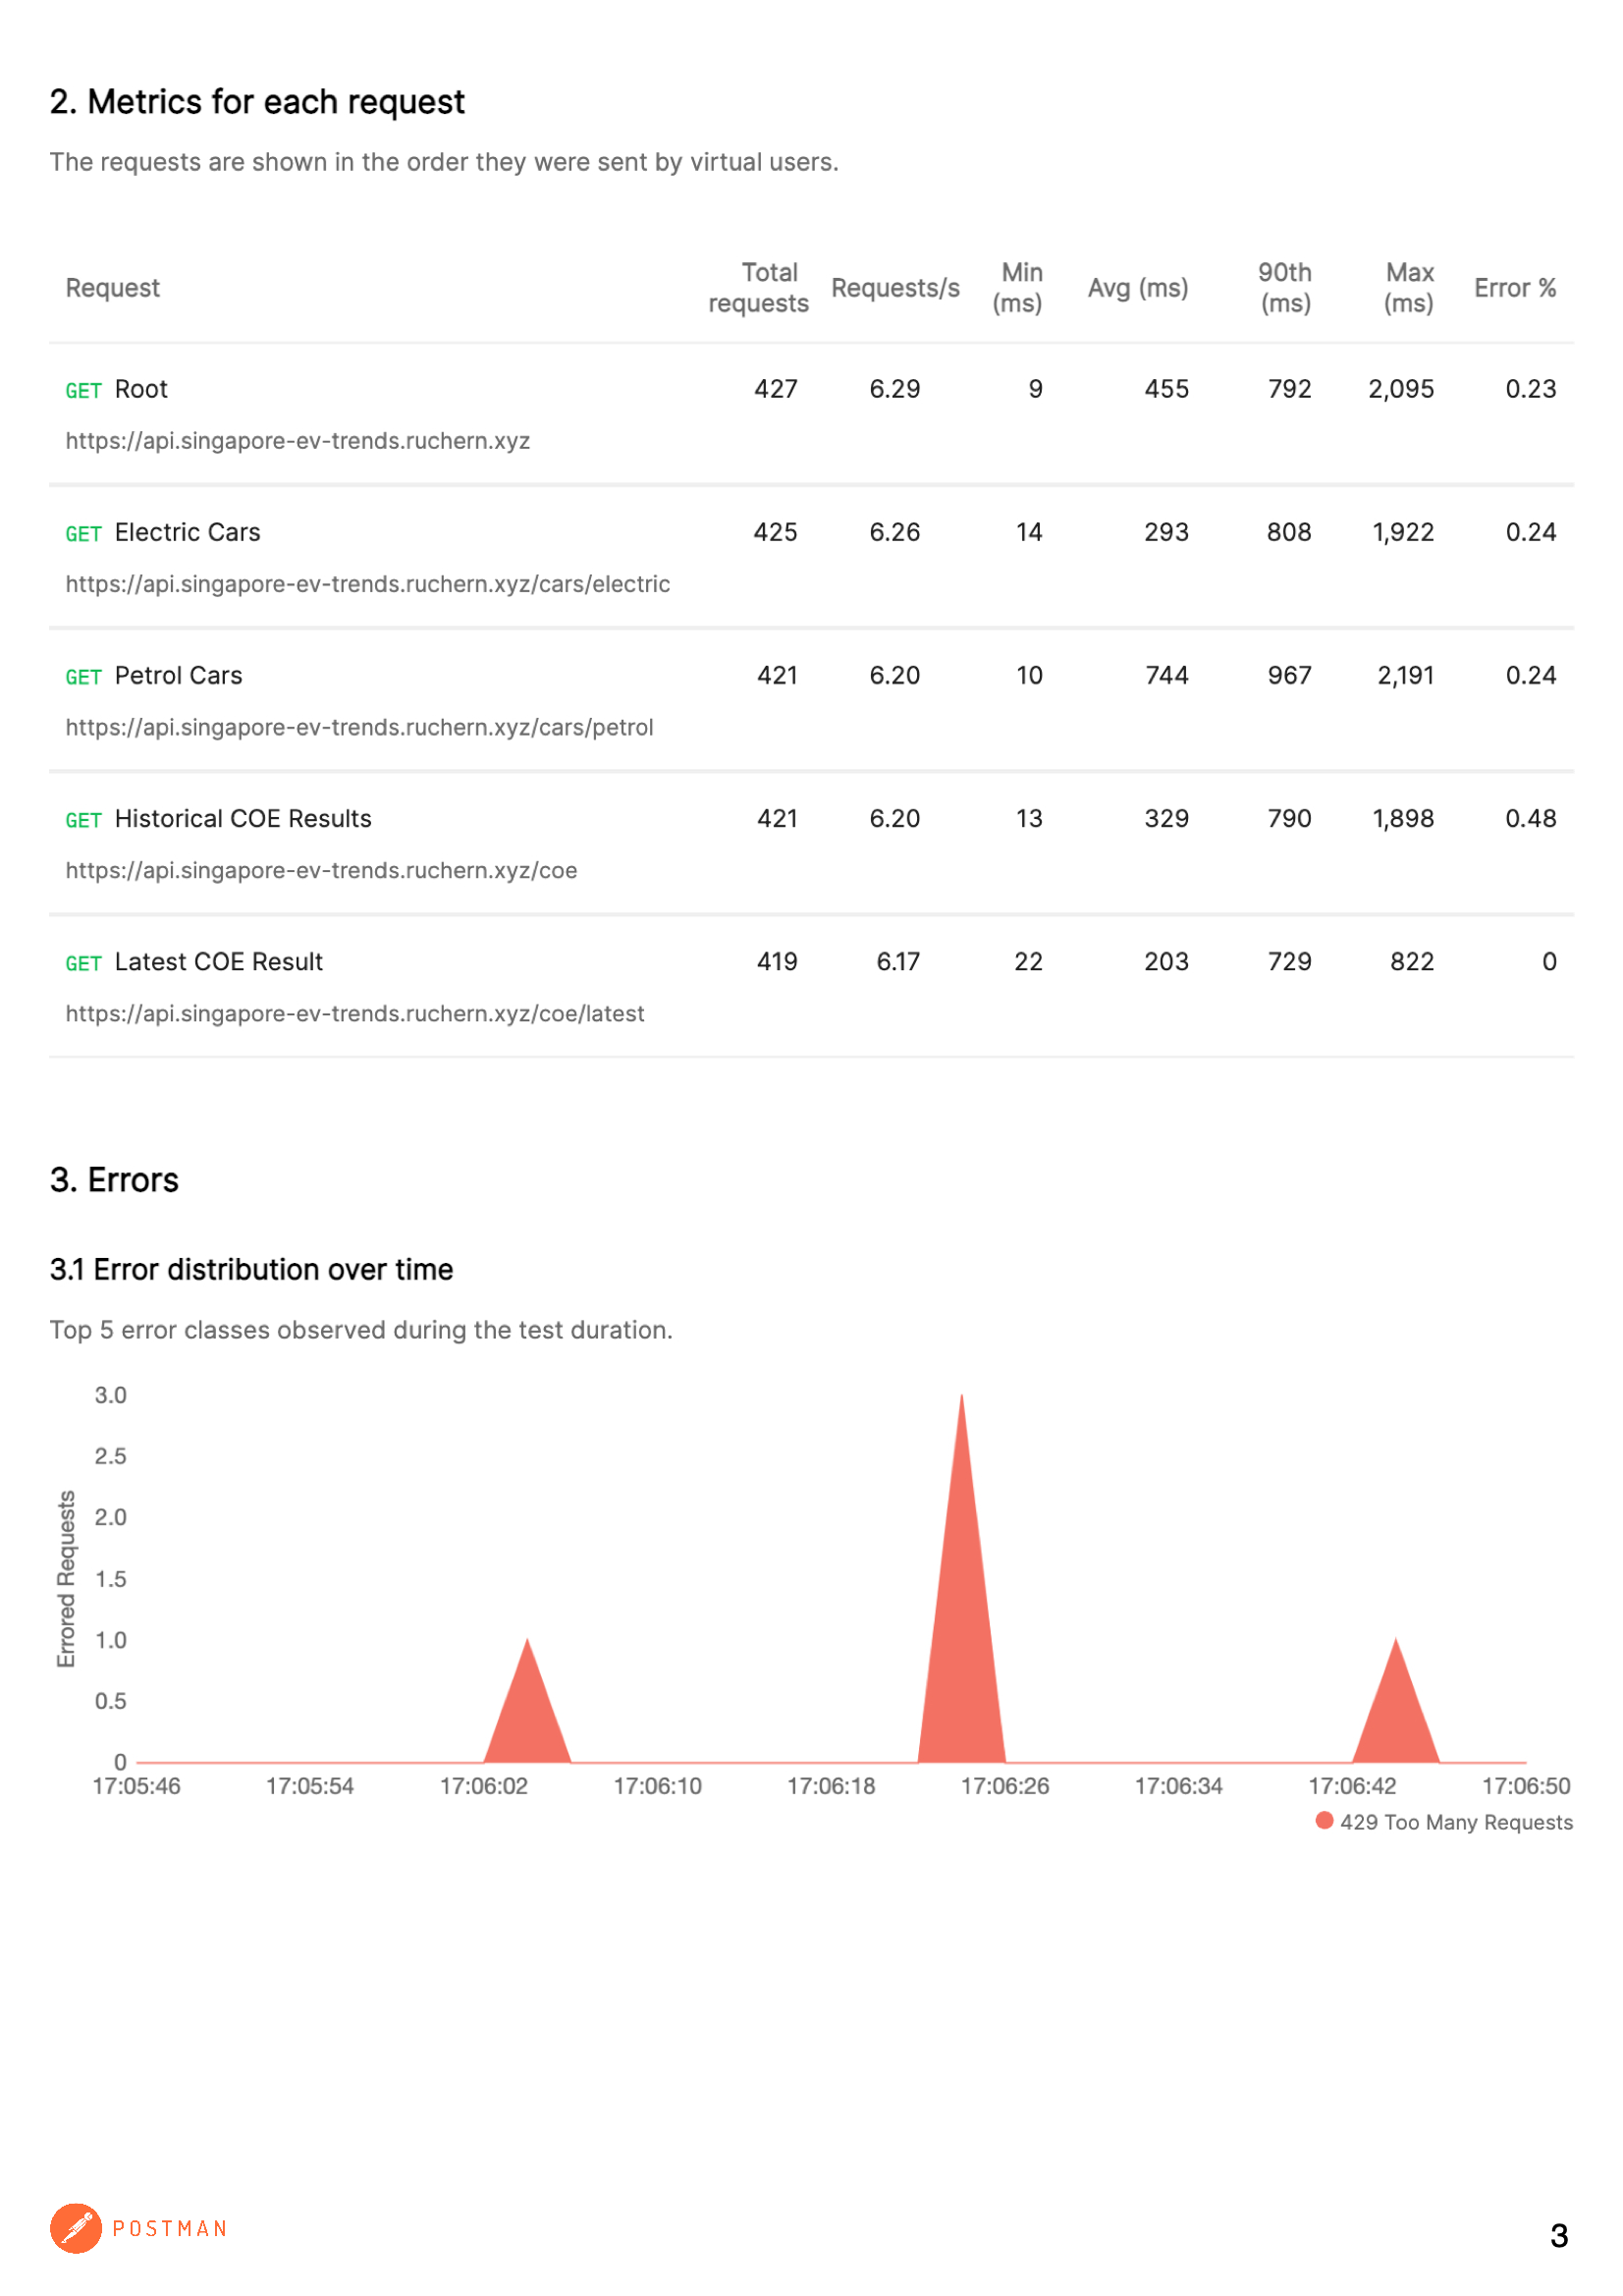
As seen from the above results, the responses are rather slow going by the "Average response time" in the first page of the report. The very next steps are to improve the performance in the best possible ways.
Future Plans
1. More Data Visualisation
As seen in the "Petrol" tab of the site, the next priority feature on the list is to build up a "Non-Electric" data visual page. Since cars in Singapore is a niche market due to how our government controls the car population, it is also good to have a visualisation of the historical trends of our non-electric cars.
Apart from cars related data, there are other interesting data published by LTA that I would love to explore and create a visual for it too.
2. API Documentation
A good documentation on how the APIs can be used is important, so this is one feature I am definitely looking to add. Currently, I am exploring Swagger. If anyone has any other alternatives to recommend, do let me know as well.
3. COE Results
LTA Datamall does not upload the COE results immediately after the end of each bidding exercise and therefore there will be a delay when updating the API. I will have to explore ways to fetch the bidding results minutes after the end of the auction through some other ways.
- Scrape the publicly published information from OneMotoring site
- Manually update the COE results into the table
4. Improving Serverless Cold Boot
Since the APIs and frontend is deployed to AWS Lambda in a serverless way, this can cause cold starts which lead to slow loading times and creating an unpleasant user experience. Performance optimisation on the cold starts will be a priority.
Closing
Lastly, I would like to thank you for your time reading my journey building the data visuals. I look forward to exploring new tools and skills to experiment with in my personal journey towards personal development.
Resources
- Charting Library - ApexCharts
- Cloud Deployment - Amazon Web Services (AWS)
- Data Source - Land Transport Datamall
- Database - MongoDB Atlas
- Frontend Framework - Next.js
- API Platform & Load/Performance Test - Postman
- Serverless Framework - SST
- CSS Framework - Tailwind CSS